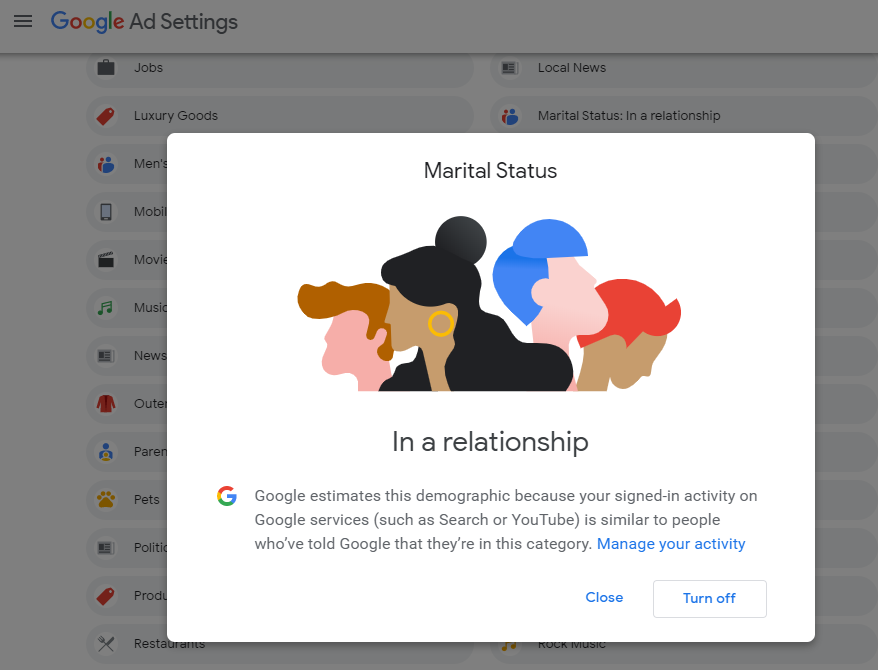
Did you know that every day you are directly affected by data? Data is information that we collect for analysis, and it forms the backbone of any informed decision. Ride public transit? Data helped determine your bus schedule. Do you see online advertisements that seem to know a lot about you? Google and other ad services serve personalized ads driven by your data and demographics.

Data can be as personal as keeping a private log of your health, or as public as global temperatures. Many datasets are private, or cost money to access, but open data is a special kind of data with three important features. It must be:
- Machine-readable, which means you can manipulate it using a computer. Think an Excel spreadsheet, not a PDF
- Freely available, a.k.a. it must be cost- and barrier-free for everyone
- Openly licensed, so it can be reused, remixed and re-distributed
Open data is available from many institutions around the globe. The Government of Canada, the Alberta Government and the City of Edmonton—including the Edmonton Public Library—each offer open data.
What does open data look like?
Open data is available in many formats, but one you’ll see a lot of is CSV.
A CSV (comma-separated values) file is basically a spreadsheet! In a CSV file, each line is a record and each record has one or more fields. The fields are separated by commas—hence the name.

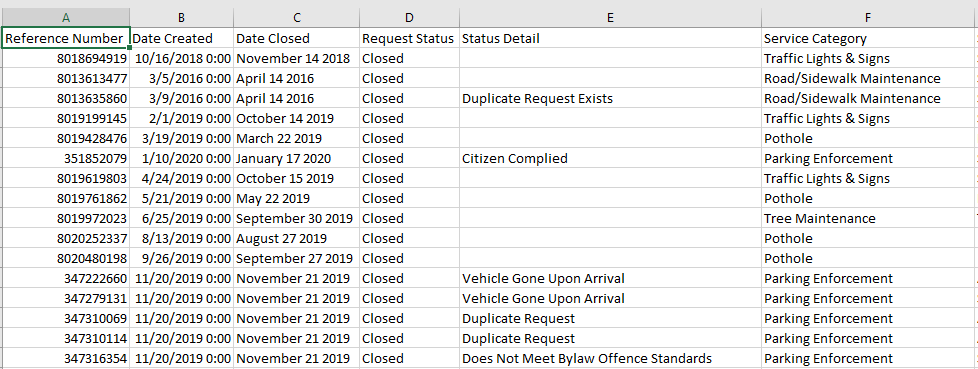
Although the data in this City of Edmonton 311 Explorer CSV file can be read in this format, it’s much easier to pull it into a software tool that lets us read and transform the data. Microsoft Excel is a great example.

See how much easier this is to read? And now that it’s in Excel format, we can use built-in tools to ask questions like, “How many times in 2018 did the City of Edmonton Parking Enforcement head downtown to investigate a 311 call, only to find that the vehicle was already gone?” 344 times. Thanks, Excel!
I've got a data set. Now what?
A good data toolkit includes software to clean and analyze data, visualization tools and programming languages. Samples include but are definitely not limited to:
- Microsoft Excel, our old spreadsheet friend (Beginner-friendly, no programming required)
- Tableau, a data visualization tool (Beginner-friendly, no programming required)
- Kepler, an open-source geospatial analysis and visualization tool (Beginner-friendly, no programming required)
- OpenRefine, a free, open-source tool for cleaning and transforming messy data (Beginner-friendly)
- R-Programming, a language that has built-in functionality for analyzing data (Programming skills required).
- Python, a language that has many free libraries with built-in functionality for analyzing data (Programming skills required)
Like many other hobbies or skills, working with open data has a learning curve and rewards the time you spend practicing.
LinkedIn Learning is a great source for tutorials, and it’s free to access with your library card!
- Data Analysis Training and Tutorials
- Introduction to Data Science (Intermediate)
- Tableau Essential Training (Beginner)
- Python for Data Visualization (Intermediate)
Data visualization is a great way to explore a dataset and communicate it in a meaningful way.
100 years of Edmonton in 6 seconds, built with #yeg #opendata, @Mapbox. Thanks @dhanalytics, and @BetaCityYEG for letting me show this off when @YEGMayorOffice @doniveson and @code4ca dropped by last week. Interactive version at https://t.co/SY60utbkHz pic.twitter.com/pHD0pNq9gB
— Eugene Chen (@ideaOwl) July 5, 2018
Why is this data so hard to work with?
Dirty data is a dime a dozen (say that five times fast). To be useful, data needs to be clean. Dirty open data might:
- Be old and out of date
- Include inaccurate information
- Include duplicates
- Have spelling mistakes
- Match data to the wrong field
In an ideal world, open data would not just be machine-readable, freely available and openly licensed; it would also be clean. Producing clean data requires time and/or money, but someone’s got to do it. Sometimes that’s the organization that shares it; sometimes that’s going to be you. Keep in mind that some of the datasets you explore may need cleaning to get the best results.
What's next?
Each year, EPL celebrates International Open Data Day by hosting an Open Data Day event to which we invite hackers, developers, designers, statisticians and anyone with an interest in open data to spend the day networking, learning and creating with open data. All levels of experience are welcome!


Add a comment to: Open Data Day 101